What is Divergence
Divergence in technical analysis refers to the relationship between two different data sets; the divergence can be between an instrument price and an oscillator, an indicator, sentiment, or another correlated instrument price or market. For many analysts, divergence analysis is considered a leading indicator and is commonly used to identify reversal points or a change in an existing trend direction on the observed time frame.
Utilizing divergence analysis (same as most if not all technical analysis tools) must always take into account the context of price action, current market conditions, and any anticipated major fundamental changes, such as changes in interest rates.Doing so helps traders get a better reading of their charts and reduces false signals, which are a common occurrence in trading. Divergence analysis is definitely not enough by itself; however, when used in the context of price action and along with other technical tools, the odds can be improved.
The Different Types of Divergence
There are multiple types of divergence and different methods of incorporating them into a trading strategy; traders scan charts either visually or by using automated scripts to identify divergences.
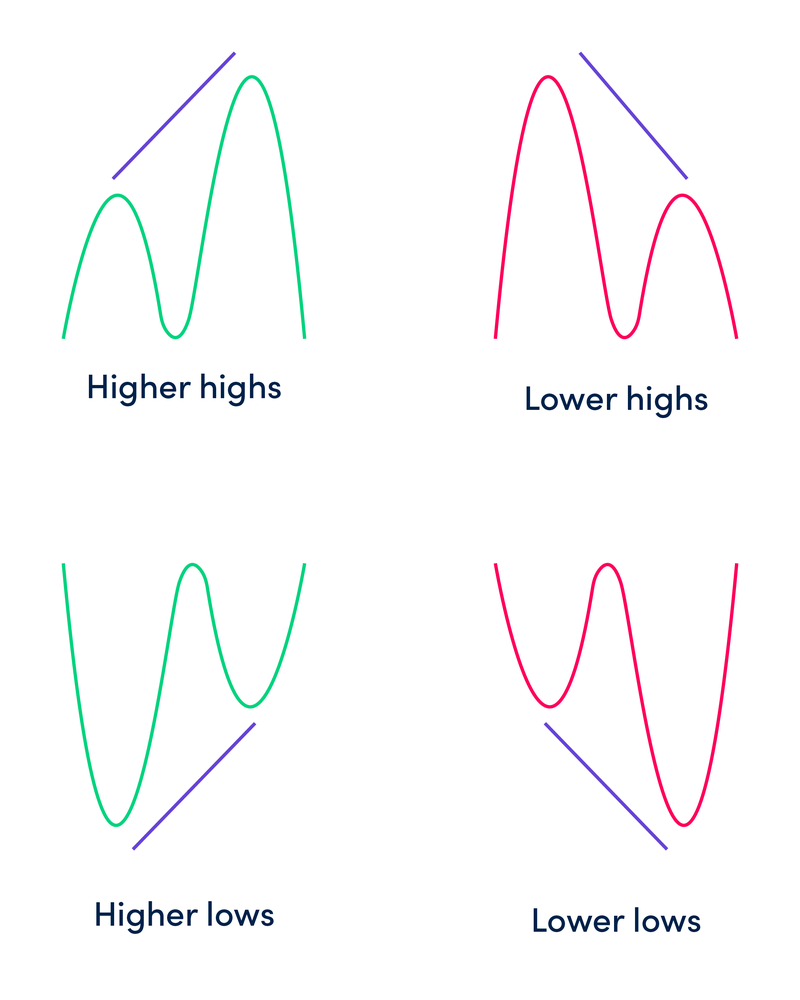
In general, there are two types: a positive or a negative divergence. A positive divergence means price is making lower lows while an indicator/oscillator is making higher highs. On the other hand, a negative divergence happens when price is making higher highs while an indicator/oscillator is forming lower lows. In both cases, this means that the indicator is not supporting the price action; this may signify a change in market trend.
Divergence analysis can be applied to various indicators and instruments data sets, including but not limited to:
- Price of a different instrument
- Indicator/Oscillators
- Market Sentiment Indicators
We will go over some practical examples of positive and negative divergences. The images below focus only on the divergences and don't show other tools or indicators used.
Price Divergence with Another Instrument Price
Many currency pairs have a high correlation to different market instruments; the relationship is part of intermarket analysis. One of which is EUR/USD and XAU/USD (gold), the average 52 week correlation coefficient is approx. +0.7, which is considered a strong to very strong price correlation. Although the price movements are not completely identical, a positive correlation means that both instruments tend to move in the same direction.
The chart below displays two examples of negative divergence between EUR/USD and XAU/USD on a 1-hour time frame. In both instances, EUR/USD is in an uptrend, while XAU/USD deviated away from its correlated uptrend and began its decline. EUR/USD follows shortly after and begins its decline.
Price Divergence with an Oscillator
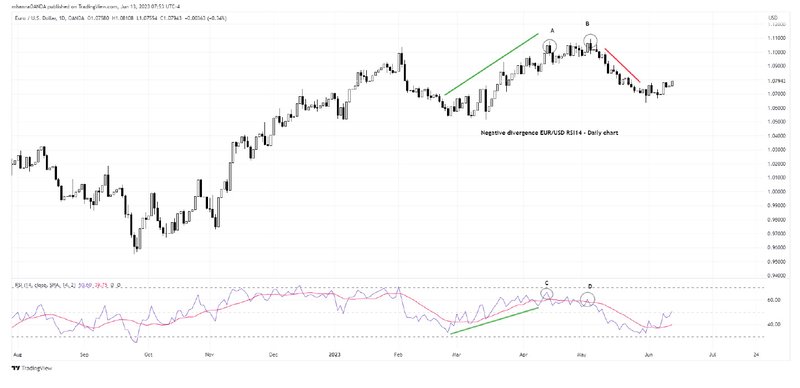
The Relative Strength Index (RSI) is an oscillator that measures the change in price percentage. In an uptrend, RSI is expected to either make higher highs along with the price action or at least remain close to overbought territory until the trend begins reversing.
On the chart below, we can see the price action making higher highs (A and B). While RSI is plotting lower highs (C and D), this represents a negative divergence and a warning that the existing uptrend may not continue.
Shortly after, the EUR/USD price uptrend began to reverse. We must always remember that Divergence by itself is not enough, and we need to look at the full context of price action.
Price Divergence with Volume indicators
There are different types of volume indicators. Amongst traders, the common definition for volume is the number of units traded within a specific period of time, for example, 1 trading day. This applies to markets that trade under the roof of an exchange such as equities or futures, however forex trading is OTC (Over the Counter), and does not trade on an exchange. Therefore, it is not possible to have real volume data while trading.
In forex trading, “tick volume” is an alternative utilized by traders to measure volume. The theory behind it is that if price is trending and there are more market participants, volatility is expected to be higher than its average and therefore, price action is expected to have more ticks than its average.
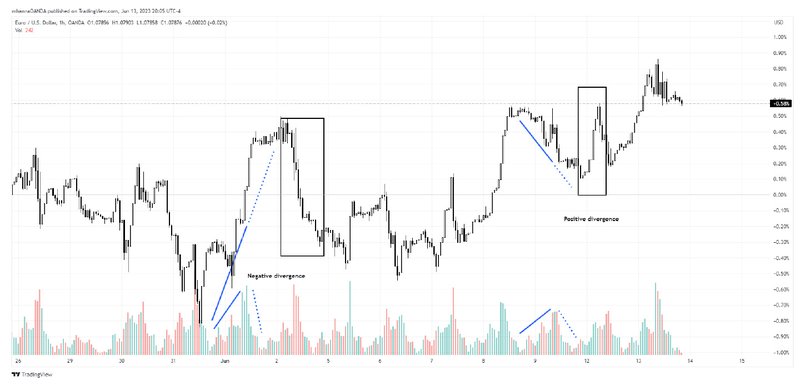
Divergence between price action and volume indicators can be a signal for a trend change. The chart below highlights a positive and a negative divergence.
We have an uptrend supported by rising volume as the trend begins (solid line), however the later part of the same trend (dotted line) experienced a declining volume.
Price Divergence with an Oscillator - Rate of Change
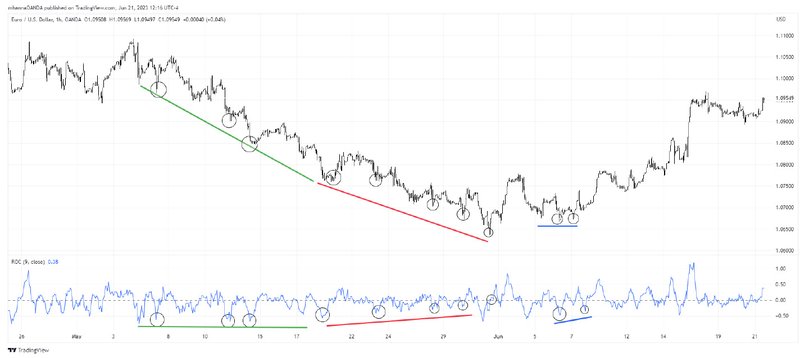
The chart below highlights two positive divergence examples on the 1-hour time frame. We have a steady downtrend on EUR/USD plotting lower lows on price action, which is initially supported by steady ROC levels. As the price continues to plot lower lows, the ROC indicator is plotting higher lows, followed by an increase in price (compare green to red lines).
Another type of positive divergence can be identified; this time price plotted two lows at the same price level, however ROC created higher lows, which were followed by upside price action (blue lines).
Price Divergence with Sentiment - Commitments of Traders
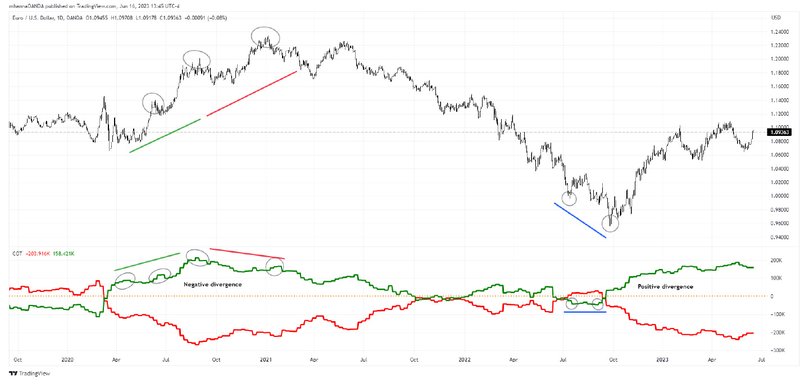
Divergence can also be utilized with sentiment; in this example, we will highlight a negative and a positive divergence on the same daily chart using the Commitments of Traders Report.
The COT report is published weekly on Friday by the CFTC (Commodity Futures Trading Commission) providing details on futures market reportable open position levels up to Tuesday of the same week. The report also provides a breakdown for long vs. short positioning with a goal of helping the public understand market dynamics.
On the left side of the chart, we have a rising price forming higher highs, which were only partially supported by COT large speculators positioning, the later part of the uptrend reflects a negative divergence as position levels formed lower highs (compare green to red lines).
On the right side of the same chart, a positive divergence appears as price continues to make lower lows while large speculators positioning maintains its prior levels.
Why do Some Traders not use Divergence Analysis?
Divergence analysis may not be appealing to all traders; this is often a matter of personal preference on what to include in their trading strategies. Some traders consider divergences to be simply normal market behavior, as all oscillators are calculated with the same price data. In this case, divergences would be classified as a normal market occurrence and would not contribute to overall trading strategy. Also, divergences may happen for other reasons, such as low trading volume or if markets are in a consolidation phase or waiting for the outcome of a major event such as interest rate or monetary policy changes.
Conclusion
It is very important to remember that divergences seen on charts can be for multiple reasons and do not constitute a signal by themselves.
For a well-rounded and holistic approach, traders should use many means of analysis within their trading strategy; divergence analysis is just one option of many.
At OANDA you find everything you need to trade smarter, so open an account now and take advantage of powerful analysis tools and tight spreads on forex pairs.
Disclaimer
This article is for general information purposes only, not to be considered a recommendation or financial advice. Past performance is not indicative of future results.
It is not investment advice or a solution to buy or sell instruments. Opinions are the authors; not necessarily that of OANDA Corporation or any of its affiliates, subsidiaries, officers or directors. Leveraged trading in foreign currency contracts or other off-exchange products on margin carries a high level of risk and may not be suitable for everyone. We advise you to carefully consider whether trading is appropriate for you in light of your personal circumstances. You may lose more than you invest. We recommend that you seek independent financial advice and ensure you fully understand the risks involved before trading. Trading through an online platform carries additional risks. Losses can exceed deposits.


