What is the Commitments of Traders Report?
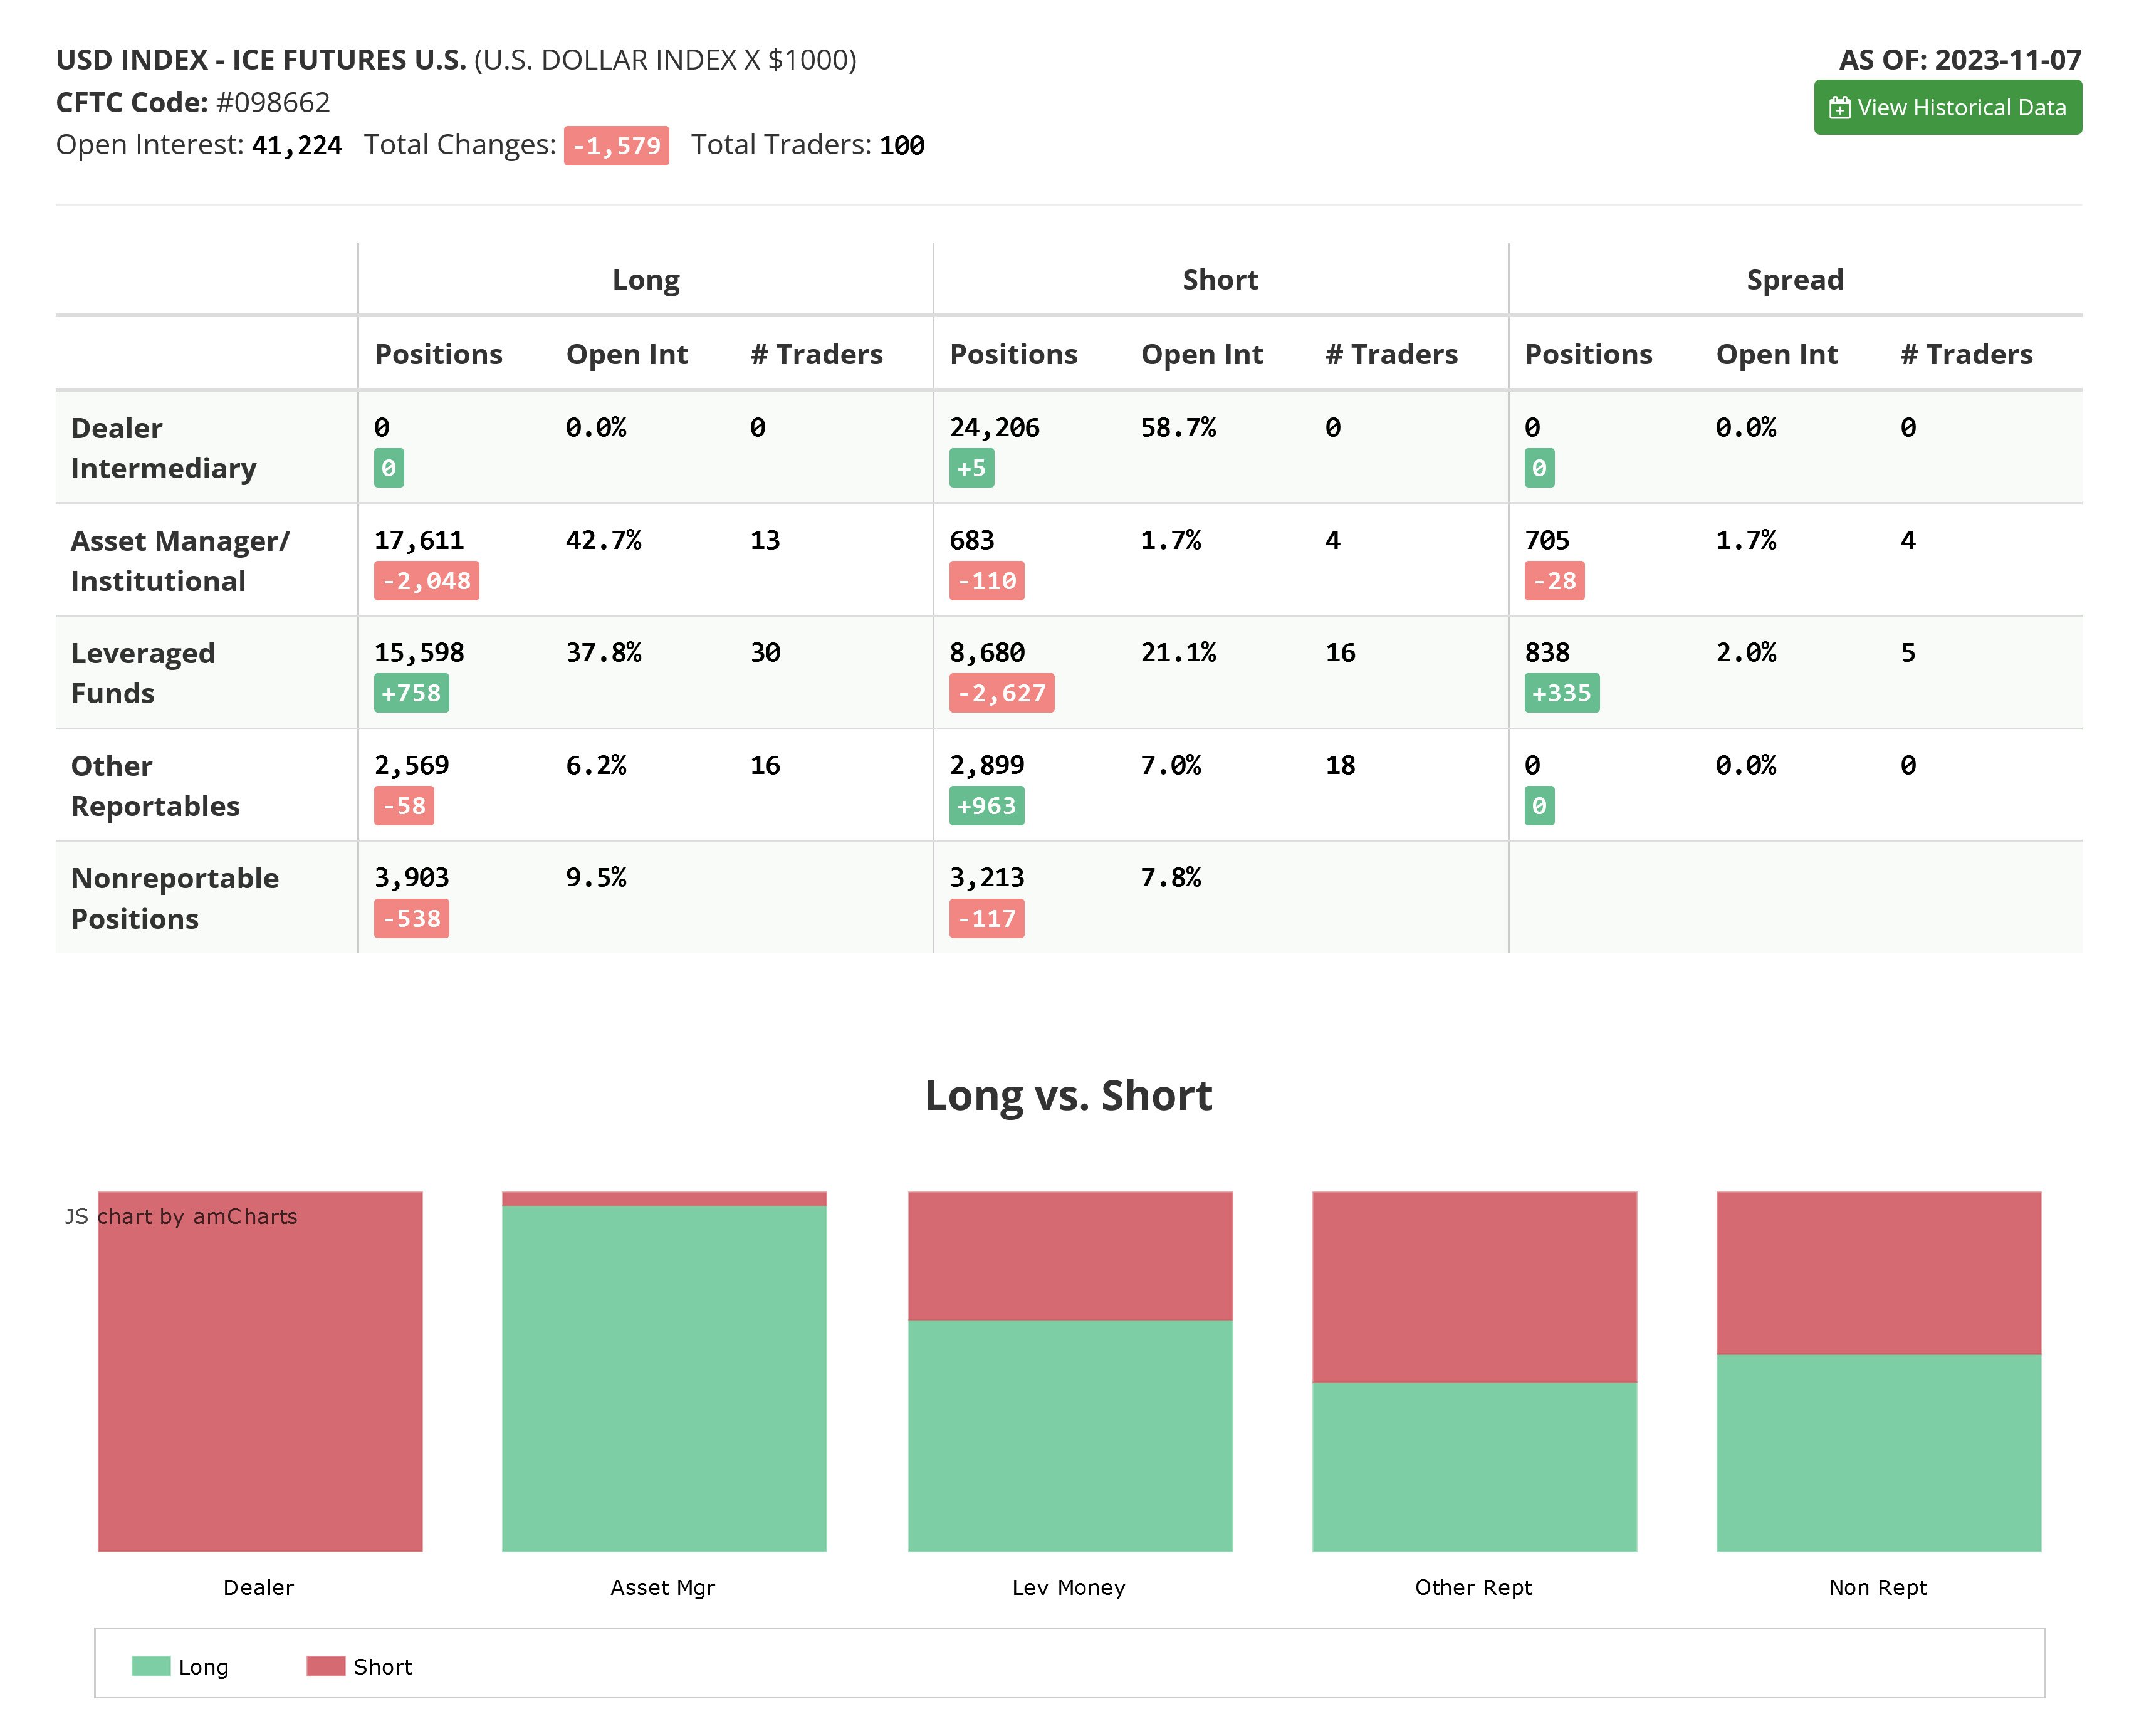
The Commitments of Traders is a weekly report published by the Commodity Futures Trading Commission (CFTC). The report provides details on traders’ positions in a categorized format according to trader type. The report is released every Friday afternoon, and its data covers up to the end of the trading day on Tuesday of the same week. The report includes data such as open position data changes, volume, and open interest changes for outright futures contracts and options on futures. The report is released in different formats and provides extensive information on historical position changes, which some traders use as part of their trading arsenal. We will focus here on the three main categories; however, there is more data and other categories available on the COT report.
Categories: Who are the participants?
Commercials & Hedgers
Commercials are traders who are primarily involved in trading a specific commodity or a financial instrument due to the nature of their business. Different types of traders and businesses utilize the futures market to hedge their risk or lock in a specific market price. Examples of commercials or hedgers can be a crop producer looking to hedge the risk of any potential decline in price in the future; an airline looking to take advantage of or lock in a low price on oil is also another example. Since commercials are hedging, their positions are usually against the market. This means that if prices are rising, commercial traders are expected to be selling, and if prices are declining, commercial traders are expected to be buying. Some traders follow commercial traders' activities closely and expect them to be the most informed category on the COT report since their business can involve producing or trading the actual commodity or instrument and therefore they are expected to have the most knowledge.
Large speculators
As the name suggests, this category represents large institutions and traders looking to speculate on different commodities and market instruments with the goal of making a profit on their speculative positions. Traders fall into this category once they exceed a specific number of traded contracts set by the CFTC for each commodity or instrument. Examples of large investors can be hedge funds, institutional investors, and other types of large financial firms that specialize in trading specific instruments as investments. This category of traders are usually trend followers and, in some cases, can also be considered a well-informed group.
Small speculators
This category includes the total positions for other market participants who don’t fall under the previously mentioned categories. This group is also another large segment of market participants and is also considered to be trend followers; however, their trading approaches towards different markets can vary significantly.
Advantages and Disadvantages of the COT
As always, all trading tools are vulnerable to criticism and can be scrutinized. Traders have different views on COT, which can vary significantly. Read on as we can summarize some of the main advantages and disadvantages of using the COT report as a trading tool.
Advantages
Inclusive and diverse
The futures market covers a broad range of market instruments, and the report can provide an overall view of different markets by comparing position levels on instruments such as FX futures, commodities, financials, interest rate-based futures, and equity futures. In this case, traders can see what market participants in other markets are doing and compare it to the instrument they are trading using intermarket analysis techniques.
Data source
One of the main problems that traders face when using various trading tools is that many indicators are based on price data, and therefore, in many cases, the different indicators end up duplicating the same message. Therefore, traders always look for different types of indicators to incorporate into their strategies.
This is where COT stands out, as it relies on a different type of data that doesn’t take prices into account; the data is simply driven from the total number of open positions and has nothing to do with instrument pricing.
Historical turning points
A major advantage of the COT report is that it provides us with historical extreme position levels. These extreme position levels, whether long or short, can be significant for traders as they may represent a turning point.
The report history provides historical positioning thresholds or extremes that were previously reached. Although markets grow and do break and create new position levels, the existing historical position levels have proved to be significant many times in the past.
Trend confirmation and divergences
In many cases, traders can identify the strength of a specific trend and use it as a confirmation tool through changes in position levels for different market participants. For example, in an ideal world, we can expect that if the price is rising, large speculators are buying while commercials are selling, and we can consider it a representation of a healthy trend. On the other hand, a divergence between the above can signal the opposite.
Market participants also look for divergences between different categories to identify potential short- or long-term reversals. For example, if prices are rising and large speculators positions are unchanged while commercials are buying (opposite of what they are expected to be doing), some market participants can consider this a divergence and a potential signal of future changes to the market price.
Sentiment
The COT report can also be considered a sentiment indicator as traders adjust their positions in anticipation of an expected event such as FED interest rate announcements or major changes in the economic or political environment. The advantage here is that the sentiment data is representative of different market participant categories as well as for each specific instrument, hence providing detailed and broken-down sentiment data that many traders find useful.
Disadvantages
Public
One of the main disadvantages of the COT report is that it is a public report; all public information is usually expected to have already been priced in or factored into the current market price since traders already know about it and have already taken it into consideration.
Non-representative
Some traders argue that COT report is only a small representation of global market participants and may not be representative for the whole market, although this may sound true, this representation can be considered a good sample as it covers different market categories and include participants who are well informed and heavily invested in their traded instruments.
Delayed
One of the most valid and commonly used arguments against using the COT report as a trading tool is the fact that the report is delayed; it is released on Friday, covering up to Tuesday of the same week, thus creating a gap where traders become unaware of the most recent changes to positioning. The argument here is that delayed data is also considered to be discounted by current market prices and therefore not useful.
How to use the COT in forex trading
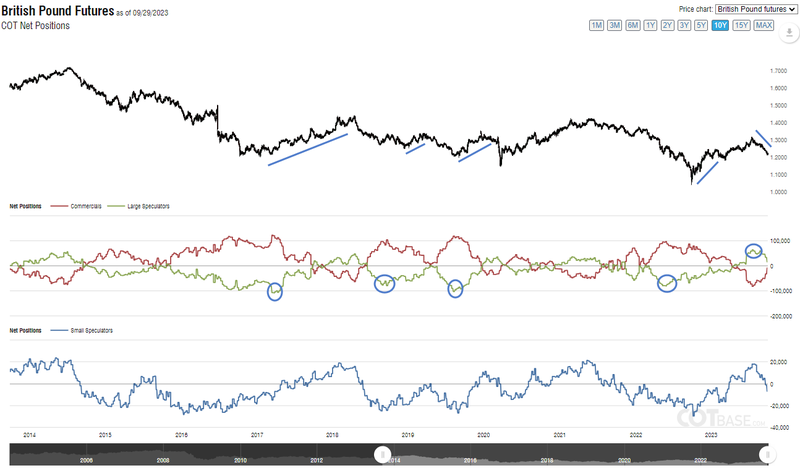
Looking at forex trading, the chart below shows GBP/USD with its COT net positions applied. The focus here is on the position levels when it reaches its all-time extreme and the price action development afterwards. The extreme levels are marked with blue circles for large speculators. We can see that historical extreme positioning levels represented historical price turning points.
As a quick reminder and as mentioned earlier, as markets grow and more participants enter the markets, extreme positioning levels can be broken and new all-time levels are created. The same chart also has examples of broken historical positioning levels.
Divergence between Price and COT positions
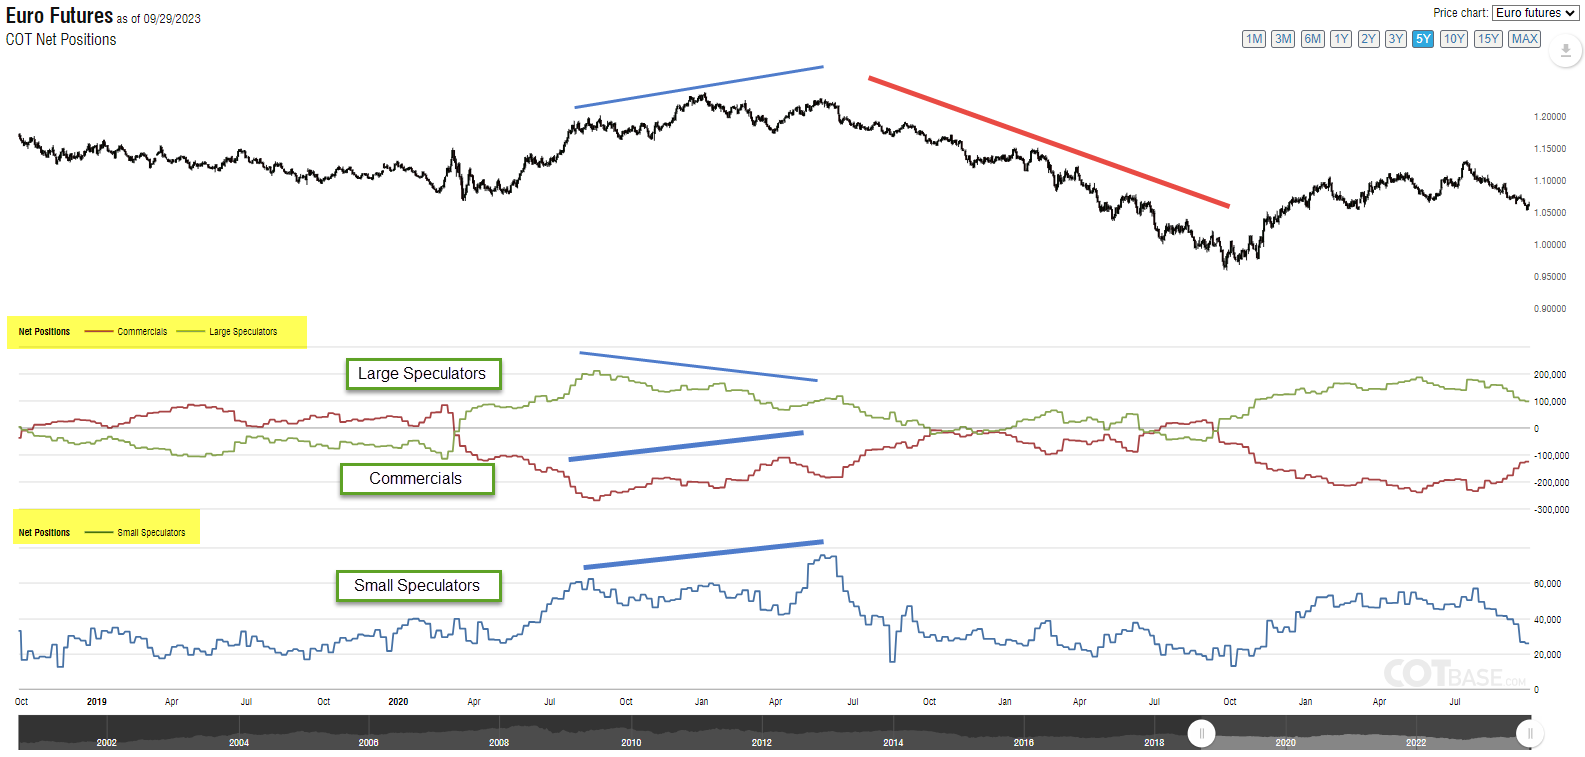
The chart below is for Euro futures with its COT data applied; the blue line on the price chart shows prices making higher highs while large speculator positions are making lower highs. We can also see commercials positioning for higher prices, which is the opposite of what to expect. Both cases represent negative divergence and reflect that both trader categories are supportive of the latest upside price action. Shortly after, the EUR/USD price entered a bear market, which lasted almost 18 months (in red).
It is also worth noting that the only trader category that was supporting and following the price action were the small speculators.
Inter-Market analysis signals
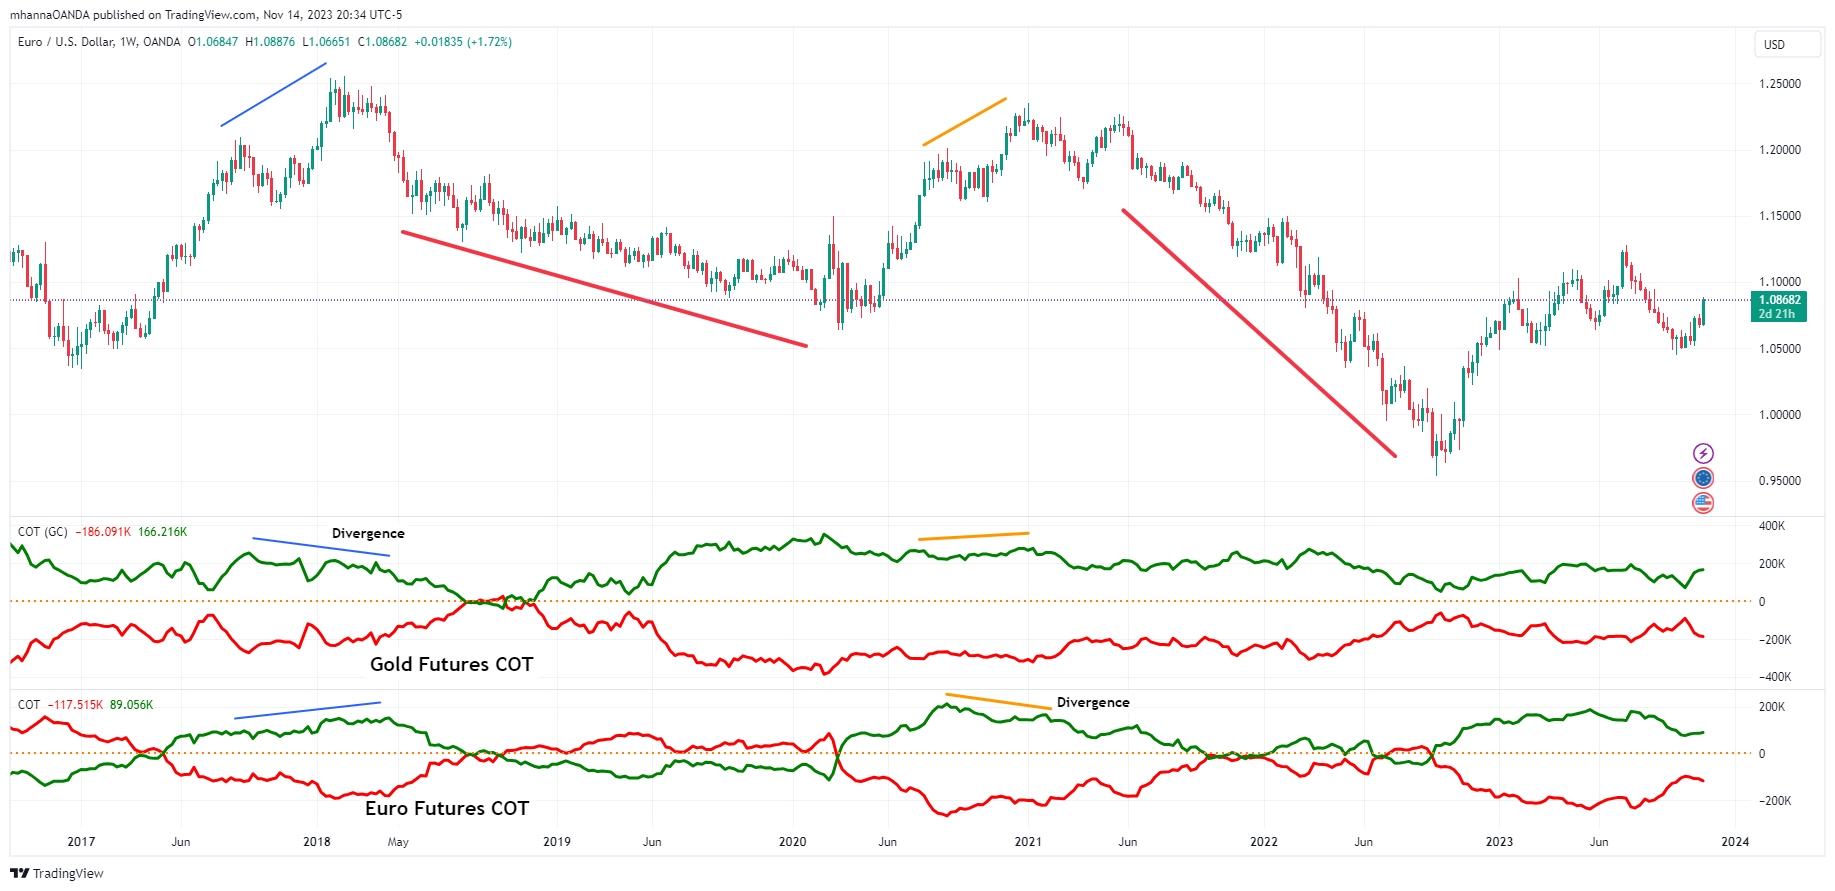
As we all know, financial markets are highly correlated, and the COT report can sometimes provide insights from other markets different from the one we are trading in. In this example, we will use gold futures COT and compare it to EUR/USD prices. The 252-day correlation currently stands at 0.58, although not very high but still meaningful.
It is important to remember that correlations change over time; however, since the Euro, British Pound, and Gold are all priced in USD, the correlation is expected to remain close to its averages unless a major change happens.
The chart below for EUR/USD has Euro and Gold COT applied; this time, the negative divergence was seen earlier on gold position levels; shortly after, EUR/USD begins a downtrend (in blue) Another divergence occurs later on; however, this time it is on Euro Futures COT and not on gold (in orange).
Conclusion
There is no magical indicator that will tell us where the market is headed; however, using different types of indicators that are independent from each other can help a trader make a more informed decision. The fact that COT report data is independent of price action makes it a different type of indicator when compared to the many and mostly used ones, and therefore it may add value to a trading plan.
The above examples are just a few ways to use the COT report. Many traders and analysts use this tool and have developed custom indicators driven by COT.
When trading with OANDA you can access a range of powerful analysis tools to identify potential opportunities and build a stronger strategy.
Disclaimer
This article is for general information purposes only, not to be considered a recommendation or financial advice. Past performance is not indicative of future results.
It is not investment advice or a solution to buy or sell instruments. Opinions are the authors; not necessarily that of OANDA Corporation or any of its affiliates, subsidiaries, officers or directors. Leveraged trading in foreign currency contracts or other off-exchange products on margin carries a high level of risk and is not suitable for everyone. We advise you to carefully consider whether trading is appropriate for you in light of your personal circumstances. You may lose more than you invest. We recommend that you seek independent financial advice and ensure you fully understand the risks involved before trading. Trading through an online platform carries additional risks. Losses can exceed deposits.


