Advanced Charts
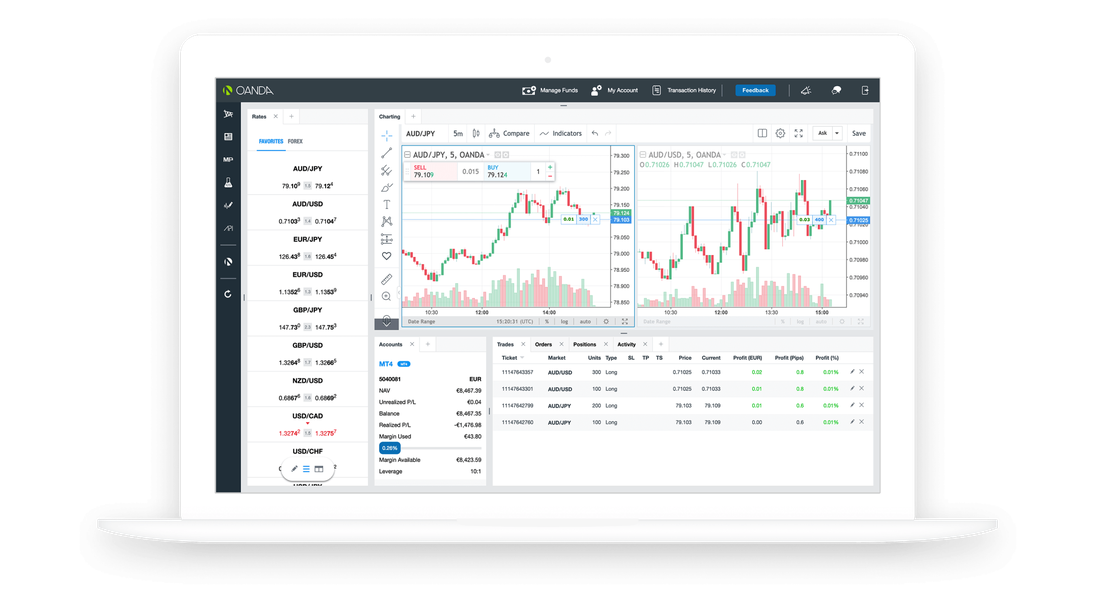
We have integrated TradingView’s world-class advanced charting solution into our OANDA Trade web platform. Advanced Charts offers a list of leading indicators and drawing tools, including trade through charts, 100+ technical indicators and more.

TradingView is the largest investment community on the web, with over 16+ million members creating, collaborating and sharing new trading charts and ideas. Their advanced charting solutions are unsurpassed in the industry and have been integrated into thousands of financial exchanges, trading websites and applications globally. Via Advanced Charts on OANDA Trade for web, you can access a range of TradingView’s most popular charts, technical indicators and drawing tools.
Are you a TradingView member? You can place trades from your OANDA account while on TradingView’s social platform.
Trade from charts
Place, view, and close trades and orders, including limit and stop orders, directly from Advanced Charts. Use the optional buy/sell panel or right-click on your chart.


11 customisable chart types
Use popular chart types, including candles, Renko, point & figure and Heikin-Ashi.

Multiple chart view
Use up to eight charts in one layout at the same time. Follow price action of different symbols or intervals and set up syncing between different charts.

Technical indicators
Choose from over 65+ popular technical indicators, including Moving Averages, MACD, Bollinger Bands®, Stochastics, Ichimoku Cloud, Volume, Aroon, Balance of Power and Donchian Channels.

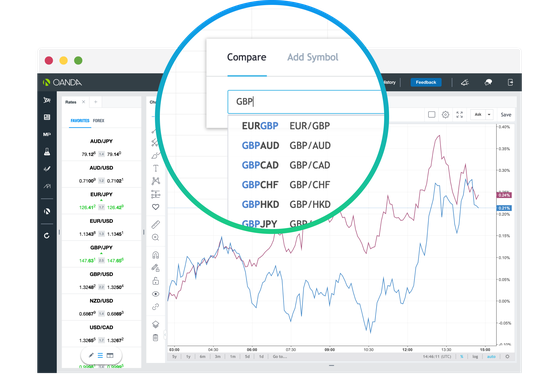
Compare symbols
Compare symbols side by side to see relative performance directly on the chart.

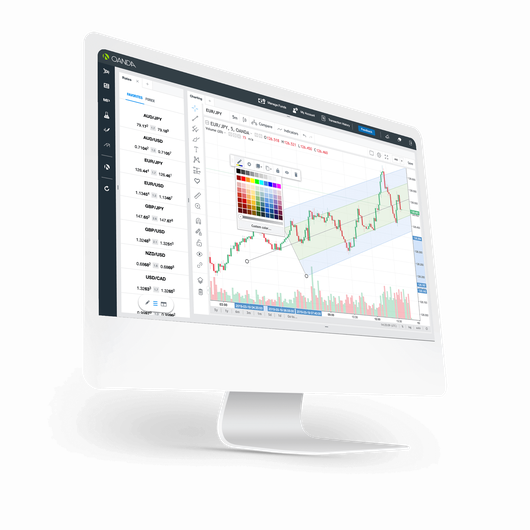
Drawing tools
Use a wide array of drawing tools to analyse market trends, including Pitchforks, Gann Fans and Elliott Waves. Make notes and add symbols to your chart for future reference using annotation tools.

Chart intervals
Analyse CFD price trends with charts ranging from five seconds (5s) to one month (1m). The ‘change interval’ option lets you view custom time periods.

Watchlists
Monitor rates and quickly switch between multiple instruments. Add symbols by searching in the 'add symbols' text field and then click on the desired instrument. Hover over an instrument in the watchlist and click on the red 'X' to remove symbols. To hide/show watchlists, click on the small arrow to the left of the watchlist (the right edge of the chart when the watchlist is hidden).
Ready to start trading? Open an account in minutes
Already have a live trading account? It's easy to fund your account using one of the following payment methods.


CFD trading
We offer CFD prices on a range of financial instruments, including indices, forex pairs, commodities, metals and bonds.
3 ways to trade, plus TradingView and MetaTrader 4
Our range of platforms include OANDA Trade web, mobile and tablet, as well as TradingView and MetaTrader 4.
Take advantage of MetaTrader 4
Our custom-built bridge combines OANDA’s pricing and execution with MT4’s charting and analysis.