Explore the S&P 500, one of the most followed stock indices globally, including its components and recent performance. Learn about investing in the S&P 500, trading CFDs on the index with OANDA, and a summary of OANDA's S&P 500 CFD trading options.
An introduction to the S&P 500
The S&P 500, or Standard & Poor's 500 Index, was created by S&P Dow Jones Indices LLC in 1957. Its constituent stocks include 500 large-cap stocks in the United States. The S&P 500, the Dow Jones, and the Nasdaq are the three key US stock market indices.
The S&P 500 covers about 80% of US stock capitalisation and is followed by many investors as a stock index determining the stock market's direction.
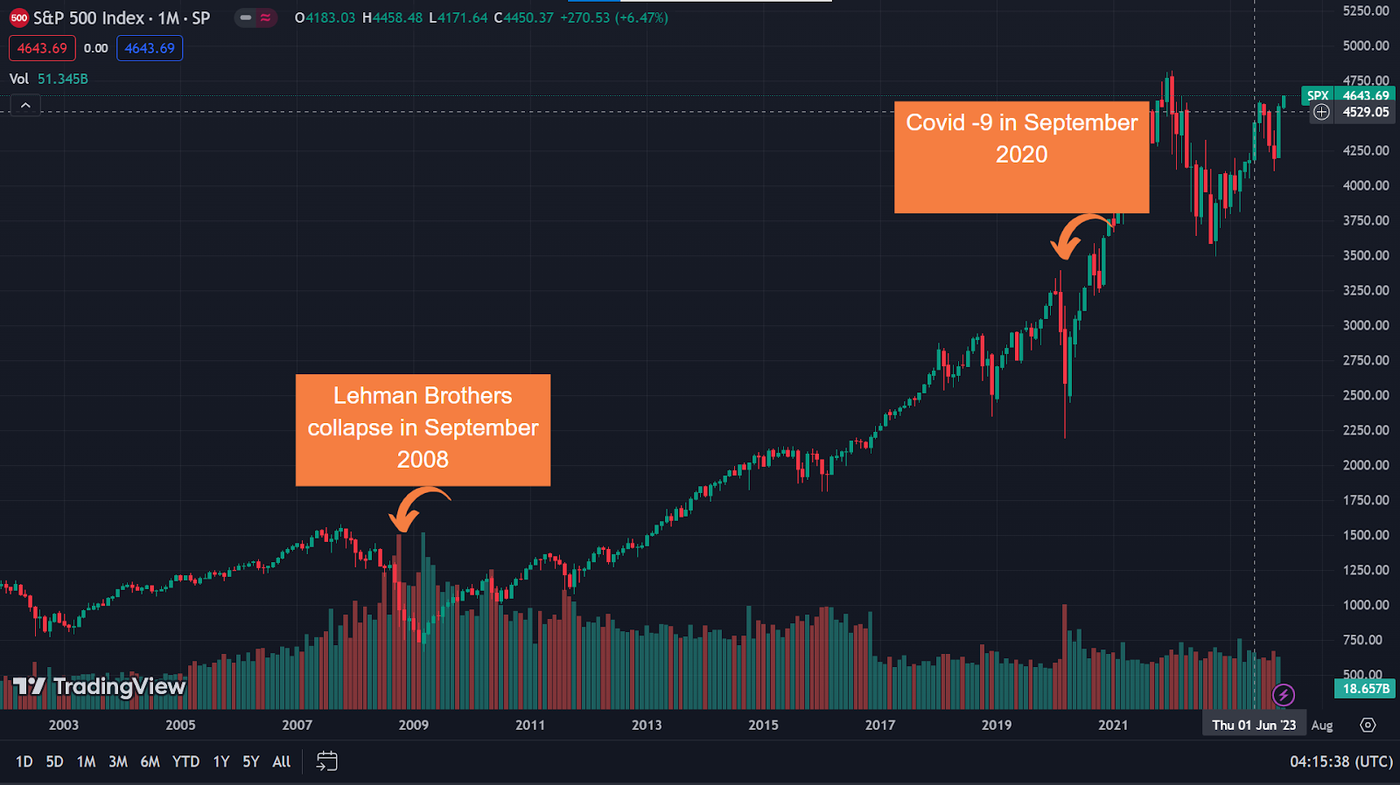
It showed an upward trend for about 13 years, from 2009 to 2021. The upward trend gradually slowed in 2022 and entered a market correction situation. As of the end of 2023, the S&P 500 posted a total return of about ~24% for the year, well above its average annual return of around 10%. Technology, communication services, and consumer discretionary stocks have notched big rebounds in 2023.
It shows that the US economy has grown dramatically since the Lehman Brothers collapse in 2008 and the COVID-19 crisis in 2020. In this context, investment trusts, ETFs, CFDs, and other investment products closely related to the evolution of the S&P 500 have attracted attention. This article will examine the features and investment methods of the S&P 500 in detail.
What is the S&P 500?
The S&P 500 Index was developed and maintained by S&P Dow Jones Indices LLC in 1957. The stocks in the index comprise 500 companies selected from listed companies on the New York Stock Exchange (NYSE) and the Nasdaq. The S&P 500 covers about 80% of the US stock market capitalization. It is closely related to the US stock market.
How is the S&P 500 calculated?
The S&P 500 is calculated using a capitalisation-weighted index.
- The capitalisation-weighted average is calculated by dividing the total capitalisation of each stock by the total capitalisation on the base date.
In simple terms, it is a method of calculating the growth multiplier by comparing past capitalisation with current capitalisation. The benefit of using the capitalisation-weighted average is that it is less affected by value stocks (companies with high stock prices) and more by companies with high capitalisation (large-caps).
- Differences between value stocks and high-capitalisation (large-cap) companies
A value stock refers to a company with a high stock price. A high-capitalization company (large-cap) is a company with a high stock price and a large number of stocks. If the number of stocks increases, the capitalisation increases.
In addition to the S&P 500, many stock indexes, such as the Nasdaq Composite Index and TOPIX, use capitalisation-weighted averages. The capitalisation-weighted average possesses a drawback as it is disproportionately influenced by companies with higher market capitalisation. This tendency can result in a disproportionate impact on the index due to the dominance of a few large-cap stocks. To address this limitation, alternative weighting methods such as equal-weighted or fundamentally-weighted indices are employed to mitigate the aforementioned issue.
As of December 2023, the top companies are Apple and Microsoft. If either one of the two underperforms, it could affect the performance of the S&P 500. As companies with high capitalisation easily influence the index, it cannot reflect the overall market, which is another disadvantage. Let’s look at the components of the S&P 500.
The components of the S&P 500
A constituent stock of the S&P 500 should meet the following criteria (as of December 2022):
- Be a US company (may have a presence overseas)
- A company must have an unadjusted market capitalization of at least $14.5 billion, and its float-adjusted market cap, meaning the portion of shares available for public trading, must meet at least 50% of this threshold.
- High liquidity: The ratio of the annual dollar value traded to float-adjusted market capitalization must be at least 0.75, meaning a substantial portion of the company's publicly available shares are actively traded on the market.
- Make profits for four consecutive quarters
- The stock must have traded at least 250,000 shares in the six months leading up to the evaluation date, confirming its liquidity and accessibility to investors.
- The stock needs to have an investable weight factor of at least 0.10.
| Constituent Stocks | Symbol | Sector |
|---|---|---|
| Microsoft Corp. | MSFT | Information Technology |
| Apple Inc. | AAPL | Information Technology |
| Nvidia Corp | NVDA | Information Technology |
| Amazon.com Inc. | AMZN | Consumer Discretionary |
| Meta Platforms, Class A | META | Information Technology |
| Alphabet Inc. A | GOOGL | Communication Services |
| Berkshire Hathaway B | BRK.B | Financials |
| Alphabet Inc. C | GOOG | Communication Services |
| Eli Lilly and Co | LLY | Drug Manufacturing |
| Broadcom Inc | AVGO | Information Technology |
| TESLA Inc. | TSLA | Automotive, and Energy Generation and Storage. |
| JP Morgan Chase and Co. | JPM | Banking |
Moreover, the constituent stocks undergo a quarterly review. Regarding the constituent stocks of the S&P 500, the table above delineates the ten companies with the highest percentage of components (as of December 2023). Please note that trading the aforementioned stocks is not guaranteed, and future inclusion is not assured. The industry classification is determined according to the Global Industry Classification Standard (GICS). These companies, including Apple and Microsoft, are widely recognised.
The movement of the S&P 500
The following chart shows the changes in the S&P 500 (as of December 2023):
We can see an overall upward trend in this twenty year period. However, the S&P 500 does not always continue to rise smoothly. It fell about 500 points due to the Lehman Brothers collapse in September 2008 and lost some 1,000 points because of COVID-19 in 2020. Despite these crises, the S&P 500 still shows strong growth. Let’s turn to the market in 2022-23.
Market corrections in S&P 500
Macroeconomic uncertainty, geopolitical instability, and a hawkish FED can drive the S&P 500 (SPX) lower. Overall, we should monitor inflation and monetary policy in the United States.
In addition to exposure to inflation in the US, the S&P 500 is also subject to changes in corporate earnings and the economy. We’ll examine the outlook for the S&P 500 from the following points:
- Inflation in the United States
- US corporate performance and economy
- Setting a long-term upward trend
Inflation in the United States
As discussed above, the S&P 500 index corrected in 2022. This is mainly because of the inflation and monetary tightening (interest rate hikes) policy in the United States. The following chart shows the US CPI trend.
In June 2022, there was a 9.1% increase over the previous year, and it continued to rise to record levels.
Now let's look at the direction of US interest rates.
The interest rate stood at 4.5% in December 2022. The Fed fund rate at November 2023 stands at 5.5%. With the rise of the CPI, US officials continued to hike interest rates to control price rises. Price corrections in the market are also being observed. In October, the US Consumer Price Index for All Urban Consumers was unchanged, seasonally adjusted, and rose 3.2 percent over the last 12 months, not seasonally adjusted. The index for all items less food and energy increased 0.2 percent in October (SA); up 4.0 percent over the year (NSA).
The market is at this moment expecting the rates to be held steady for some time to come but does not expect a rate cut anytime soon.
US corporate performance and economy
Earnings Per Share (EPS) is one of the indicators for business evaluation. EPS is the amount of profit per share. It reflects the profitability and growth of a company and is followed by many investors. EPS can be calculated through the S&P 500 and is regarded as a leading indicator of the index. The following chart shows the S&P 500 versus the EPS:
The gray sections indicate periods of recession. Once the EPS falls, the S&P 500 will fall as well. Entering a recession represents a more significant decline. The definition of what a recession is varies from country to country. (The US Department of Commerce uses the NBER (National Institute of Economic Research) economic criteria).
The NBER’s definition of a recession is as follows:
- Downturn in economic activity
- The decline has continued over several months
- The GDP has fallen
The following chart shows the change in the US GDP over the past few quarters.
For the period January-March 2022, it was down 1.6%, and for the period April-June 2022, the GDP fell 0.6%, showing negative growth for two consecutive quarters. As a result, the United States was considered to be in a technical recession at that time. The economy has shown resilience ever since, and the Bureau of Economic Analysis, an agency embedded in the U.S. Department of Commerce, estimates that as of the third quarter of 2023, the economy grew at an annual rate of 4.9%.
Setting a long-term upward trend
Although the above examines the outlook based on inflation and economic trends in the United States, the S&P 500 shows an upward trend in the long term. Let’s look again at the movement of the S&P 500:
There were short-term corrections during the Lehman Brothers collapse and the COVID-19 crisis. But in the long term, these crises become a turning point for subsequent rallies.
Analysing the inflation and economic trends in the United States can be one of the investment strategies to find a buying opportunity. For ways to invest in the S&P 500, please see section below, ‘How to invest in the S&P 500.’
Other crucial US stock indexes
Apart from the S&P 500, the Dow Jones and Nasdaq are key stock indices in the United States. Therefore, investors in American stocks follow three indexes.
- Dow Jones Industrial Average
- Nasdaq Index
- Russell Index
We will examine each one in detail below.
Dow Jones Industrial Average
The Dow Jones (Dow Jones Industrial Average) is an index of stock prices created and released by Dow Jones (today the S&P Dow Jones Industrial Average). It has been published since 1896 and is the oldest index in the United States. The Dow is based on the average price of 30 typical stocks listed on the New York Stock Exchange (NYSE) and NASDAQ.
What is the Dow stock price?
It is a method of calculating the average stock price developed by Dow Jones.
It can be calculated by ‘total stock price of components ÷ number of components ÷ divisor.’
The Dow Jones Industrial Average features the need to correct the divisor in case of any change in the components.
In this way, the index remains consistent.
The following table shows the difference between the S&P 500 and the Dow Jones.
| S&P 500 | Dow Jones | |
|---|---|---|
| Number of constituent stocks | 500 stocks | 30 stocks |
| Calculation method | Capitalisation-weighted average | Average stock price |
| Features | Exposed to large-cap companies | Exposed to value stocks |
The biggest difference is in how it is calculated.
The Dow is calculated using the average stock price method, which is characterized by its vulnerability to value stocks.
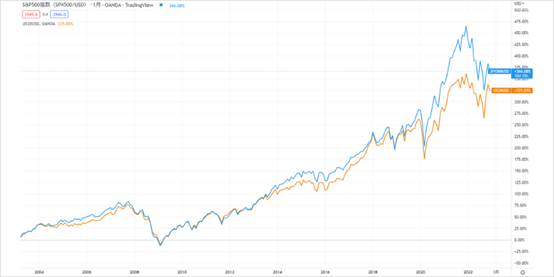
Many investors follow this stock index, as with the S&P 500, to monitor the direction of the US market. The following chart compares the performance of the S&P 500 with the Dow Jones over about 2 decades, from 2003 to 2022.
Nasdaq Index
The Nasdaq is the stock market operated by the National Association of Securities Traders.
It focuses on high-tech and IT-related companies and is the largest in the world's stock market of emerging enterprises (venture capital companies).
The Nasdaq market has two indexes:
- Nasdaq Composite
- NASDAQ 100
The Nasdaq in detail:
The Nasdaq Composite is based on the capitalisation-weighted average of more than 3,000 stocks listed on the Nasdaq exchange. Its components are mainly Apple, Microsoft, Amazon, and other hi-tech and IT-related companies. It helps understand the trends in the hi-tech sector.
The NASDAQ 100 index is based on the capitalization-weighted average of the top 100 stocks listed on the Nasdaq. It focuses on the hi-tech sector, and its components do not include stocks from the financial sector.
Compared to the Nasdaq Composite, it can better identify the trends related to hi-tech and IT. However, changes in the hi-tech sector significantly impact the performance of the NASDAQ 100. The following table shows the differences between the Nasdaq, the Nasdaq Composite Index, and the NASDAQ 100 .
| Nasdaq | Nasdaq Composite | NASDAQ 100 | |
|---|---|---|---|
| Number of constituent stocks | More than 3,000 stocks | 100 stocks | |
| Method of calculation | Capitalization-weighted average | Capitalization-weighted average | |
| Features | The stock market | It can be used to analyze trends in the hi-tech sector and the Internet | · Top 100 stocks excluding financial· Greater focus on the hi-tech sector than the Nasdaq Composite |
Now, let’s compare the performance of the S&P 500 with that of the Nasdaq Composite Index and the NASDAQ 100.
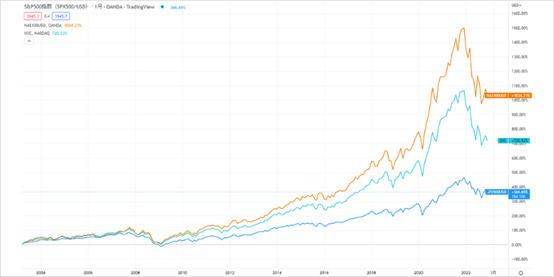
The following chart compares the performance of the S&P 500 with that of the Nasdaq Composite and the NASDAQ 100 over some 20 years, from 2003 to 2022.
The S&P 500 follows the positive trend of the Nasdaq Composite Index and the NASDAQ 100 .
Russell Index
The Russell Index is an index of small-cap stocks calculated and released by Russell Investments, a US advisory firm.
The Russell 2000 is calculated based on the capitalization-weighted average adjusted for floating stock prices for the top 1001-3000 stocks listed on the New York Stock Exchange (NYSE) and Nasdaq (other indexes include the Russell 1000 and Russell 3000).
It targets small-cap stocks in the United States and is used as a benchmark by many small-cap funds.
The Russell 2000 is focused on small-cap stocks and is sensitive to economic trends.
It is also the ‘leading indicator of a sharp decline.’ The Russell 2000 often falls earlier than large companies when the US economy deteriorates.
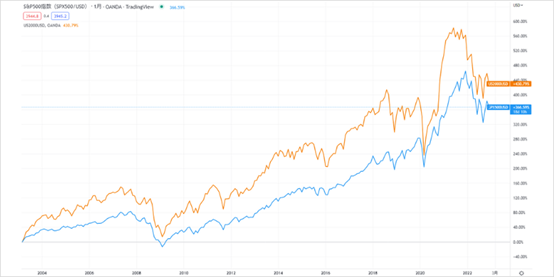
So, let's compare the performance of the S&P 500 with the Russell 2000.
Nikkei Stock Average
Although not based in the United States, Japan has several key stock indexes.
One of them is the Nikkei Stock Average.
It is calculated and published by the Nikkei newspaper.
Out of about 2,000 stocks listed on the prime market of the Tokyo Stock Exchange, 225 stocks with high liquidity are selected and calculated based on their average stock price.
In addition, the TOPIX (Tokyo Price Index) is also one of the key stock indexes in Japan.
It is calculated and published by JPX Research Institute of the Japan Exchange Group.
Its calculation is based on a capitalization-weighted average of about 2,000 stocks listed on the Tokyo Stock Exchange's prime market, adjusted for floating prices.
The following table compares the differences between the Nikkei and TOPIX.
| Nikkei Stock Average | TOPIX | |
|---|---|---|
| Number of constituent stocks | 225 stocks | About 2,000 stocks |
| Calculation method | Average stock price | Capitalization-weighted average |
| Features | Exposed to value stocks | ·Exposed to large-cap companies |
The following chart compares the performance of the S&P 500 with the Nikkei Stock Average and TOPIX over a roughly 20-year period from 2003 to 2022.
The US and Japanese economies move in parallel. But compared with the S&P 500, the Nikkei and the TOPIX have not risen as much. There are various ways to invest in the S&P 500, including ETFs and CFDs.
Let’s look at each one in turn.
How to invest in the S&P 500
As the S&P 500 is only a statistical number, trading must be based on its derivative products. Currently, the most common instruments for the S&P 500 are ETFs and CFDs.
ETFs are suitable for long-term investment due to their relatively high commissions. If you prefer short-term investments or are short traders, CFDs are the best option.
CFD trading
CFD stands for "Contracts for Difference."
CFDS can be traded in either long or short positions on stock indexes, forex, precious metals, commodities, and other products with margin without holding assets.
There are four key advantages to trading CFDs on the S&P 500.
- Leverage is available for trading
- Most products can be traded 24 hours a day (may vary depending on the stock)
- You can buy/sell CFDs in real-time
- CFDs can be a risk hedge for investment trusts and ETFs
While individual stocks may have different schedules, most CFD trading is available 24 hours daily. Even busy users can trade easily.
With highly leveraged CFDs, you can trade with a small amount of funds, which is much more effective than trading ETFs.
However, highly leveraged trades carry the risk of significant losses, so monitoring risks in a market where traders cannot accurately predict future price movements is crucial.
Now let's examine the disadvantages.
There are four disadvantages to investing in the S&P 500 through CFDs.
- You will not receive dividends
- You will pay funding charges (overnight interest)
- Spreads will be charged
- There is a risk of margin closeout (mandatory liquidation) when certain losses occur
CFD trading involves funding charges.
Also known as ‘overnight interest,’ it is paid if a position is held from one day to the next.
In the case of holding long positions, the accumulated funding charges may result in lower returns.
To start trading CFDs on the S&P 500, choose OANDA. Please refer to the detailed instructions below to get started.
How to trade S&P 500 CFDs with OANDA
Start to trade S&P 500 CFDS with OANDA is easy:
- Complete the online registration application
- Review your profile (no ID information required)
- Deposit funds (deposit immediately using a credit card)
- Install a trading platform (MT4, MT5, fxTrade)
- Start trading
Once you have completed the online application, you can open an account on the same day.
Summary
Here’s a summary of the S&P 500-related content described in this article.
- The S&P 500 is a stock index suitable for tracking the trend of the US market
- It consists of 500 companies listed on the New York Stock Exchange and NASDAQ
- It is exposed to stocks with high capitalization, not value stocks
- The market corrected in 2022, but it is expected to rise in the long term
- CFDs are suitable for short-term trading


