Master the art of using charts in MetaTrader 4 (MT4) with this comprehensive guide. From opening charts to modifying details, aligning multiple charts, and customising and saving charts.
MT4 Chart Basics
How to display a chart?
You can display a chart in 4 different ways:
From the Menu Bar > Files
In the menu bar, click ‘Files’ and select ‘New Chart’; then select the currency pair.
From the Menu Bar > Windows
In the menu bar, click ‘Windows’ and select ‘New Window’, then select the currency pair.
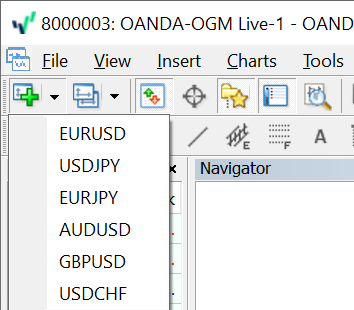
From the Tool Bar
In the tool bar, click ‘Create a New Chart’ and select the currency pair.
From Market Watch
Right-click on the currency pair you want to display in ‘Market Watch’ and click the ‘Chart Window’.
How to modify chart details?
You can modify the period, chart type, and zoom.
Modify the period
Click on the chart you want to modify. In the tool bar, click ‘Period’.
M1: 1-minute chart
M5: 5-minute chart
M15: 15-minute chart
M30: 30-minute chart
H1: 1-hour chart
H4: 4-hour chart
D1: daily chart
W1: weekly chart
MN: monthly chart
Modify chart type
Click ‘Chart Type’.
From left to right, you can choose from a Bar, Candlestick, or Line chart.
Modifying zoom
Click ‘Zoom in’ or ‘Zoom out’ to adjust the zoom level on the chart.
Use the auto-scroll and chart-switching features
Auto-scroll button: As time progresses, the chart automatically moves to the left side.
Chart switch button: Move the chart to align the right side of the chart with the right side of the window.
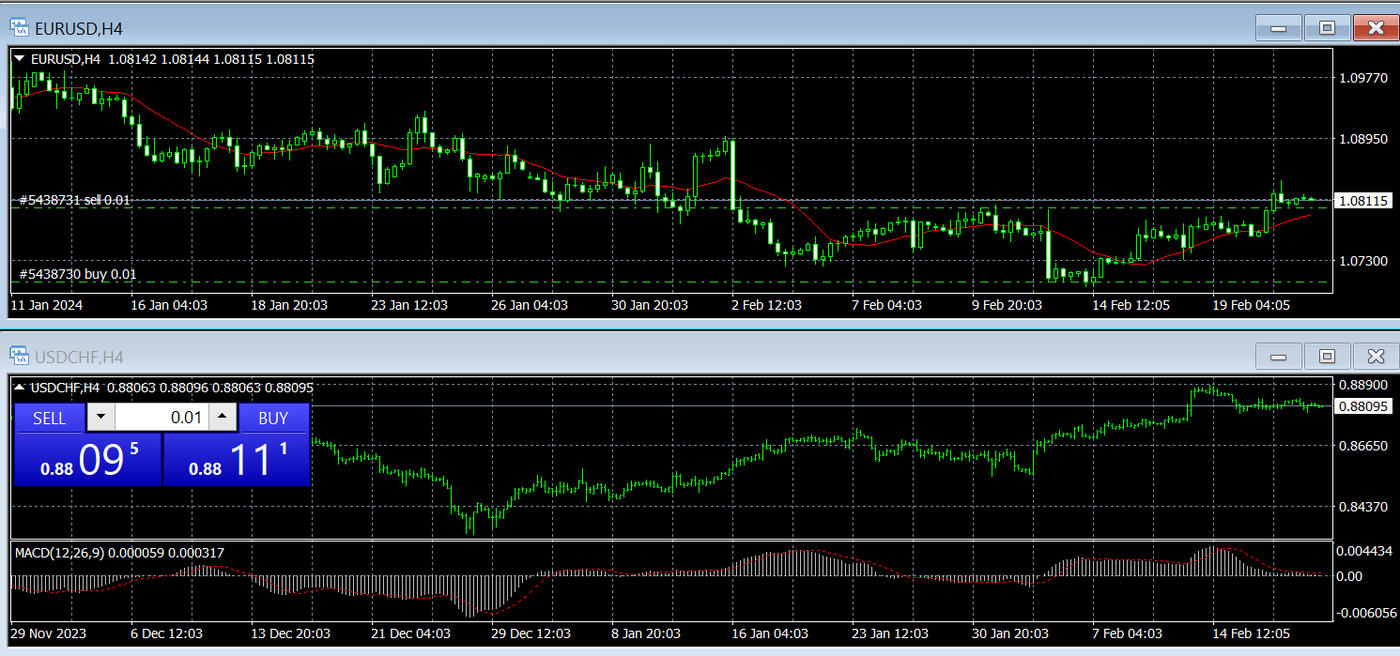
How to align multiple charts?
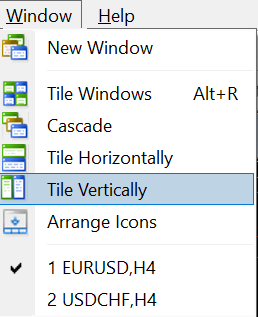
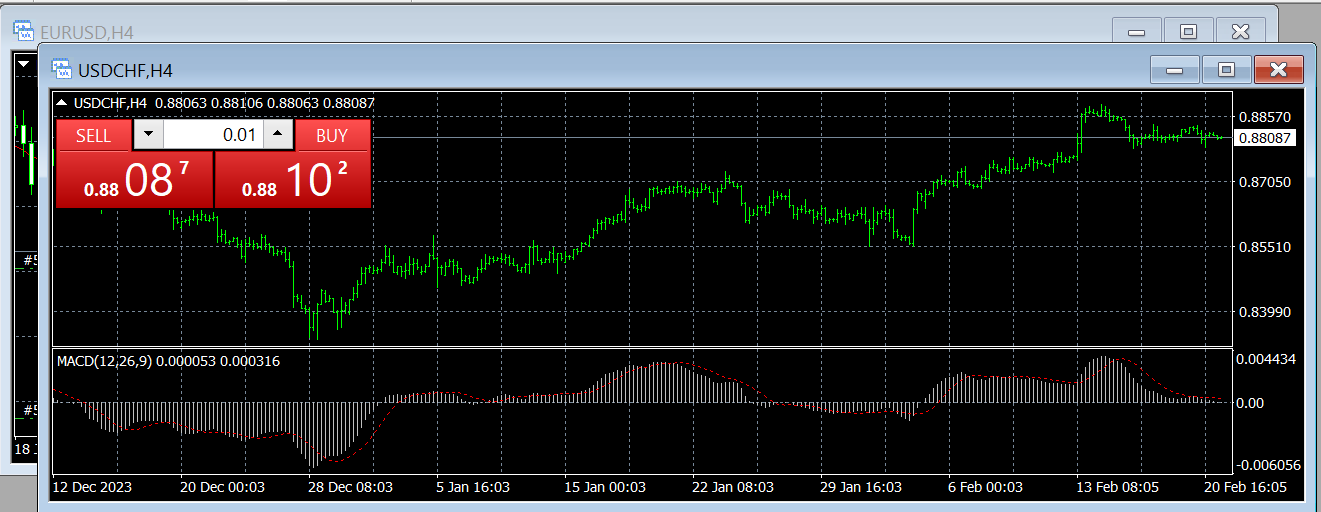
To align the windows of multiple charts, you can use the ‘Tile’ and ‘Cascade’ options from the ‘Window’ menu.
Split a chart horizontally
Click ‘Tile’ in the Window menu
Split a chart vertically
Click ‘Cascade’ in the Window menu.
How to display technical indicators?
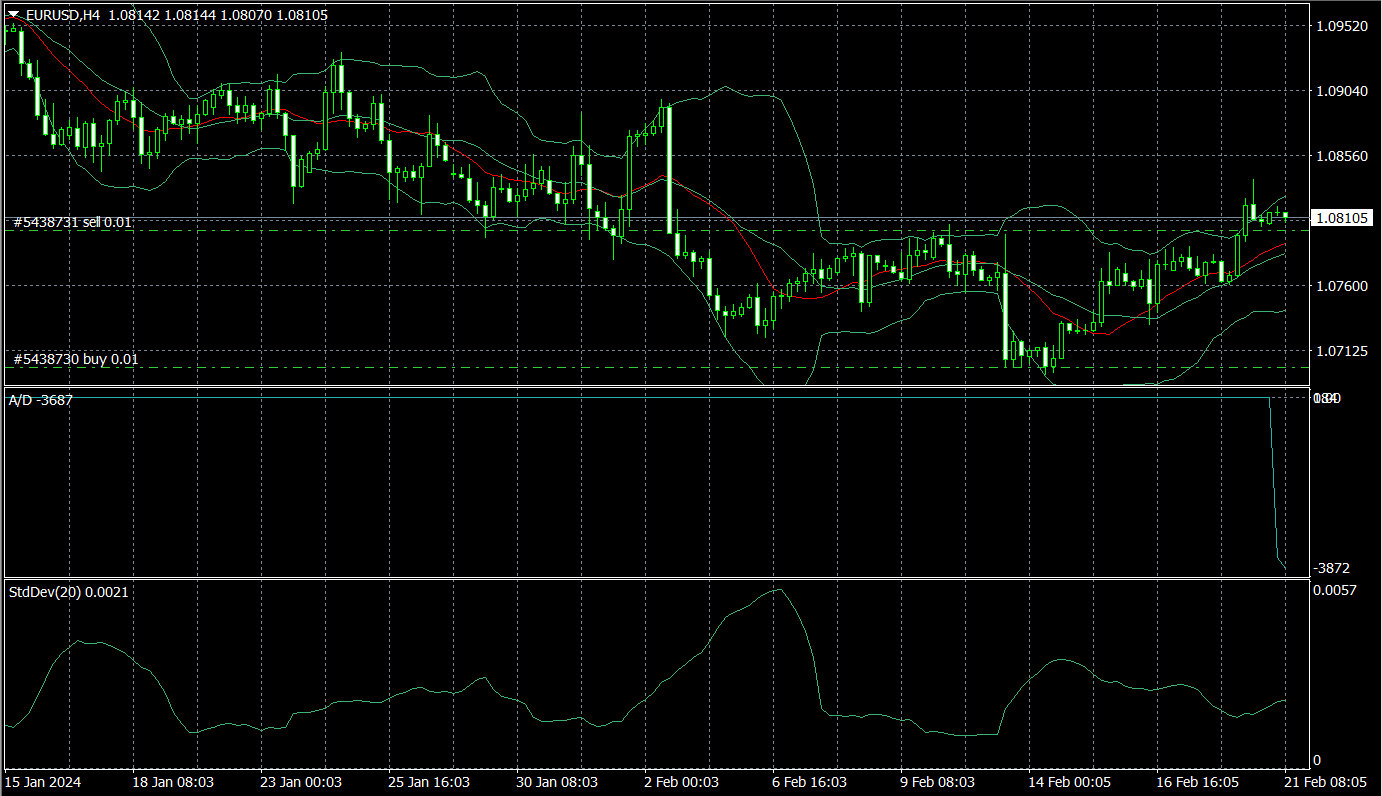
You can display technical indicators in three ways.
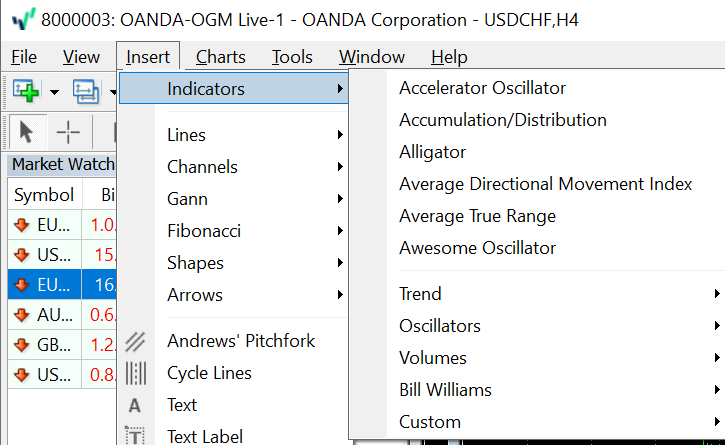
- Click ‘Insert’ in the menu bar. From the drop-down menu, select ‘Indicators’.
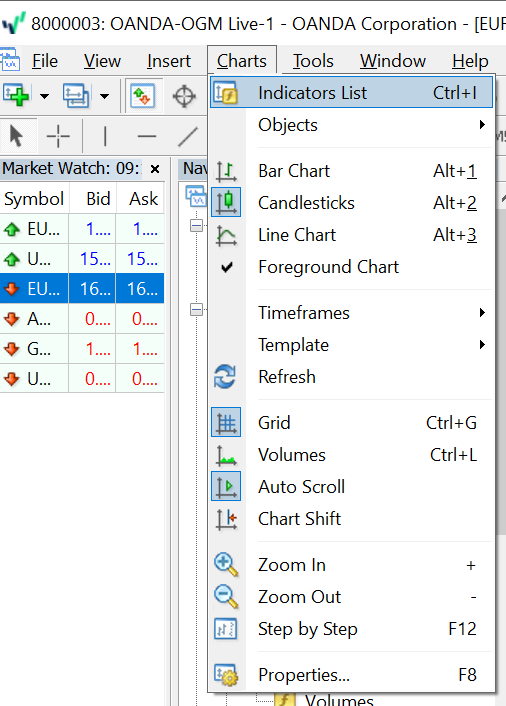
A pop-up menu will appear with a list of available indicators. Choose the one you prefer from the menu. - Click ‘Indicators List’ in the menu bar.
A pop-up menu will appear with a list of available indicators. Choose the one you prefer from the menu.
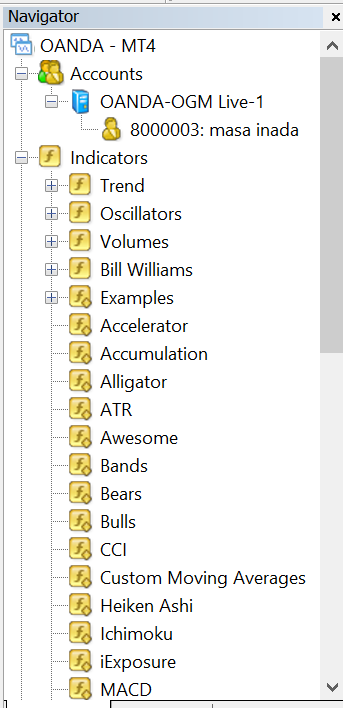
You can also display the technical indicators via the Navigator Window.
In the ‘Navigator’ window, locate the ‘Indicators’ section. Browse through the available indicators and select your preferred one.
How to modify parameters?
To change the parameters, please follow these steps:
- Click the object on the chart that you want to modify.
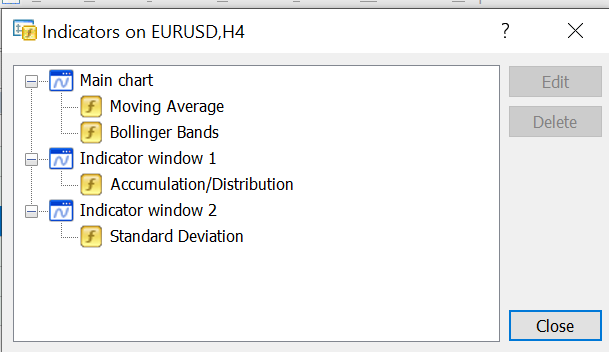
- Click ‘Indicators’ in the ‘Chart’ option in the menu bar.
- Select the object parameters.
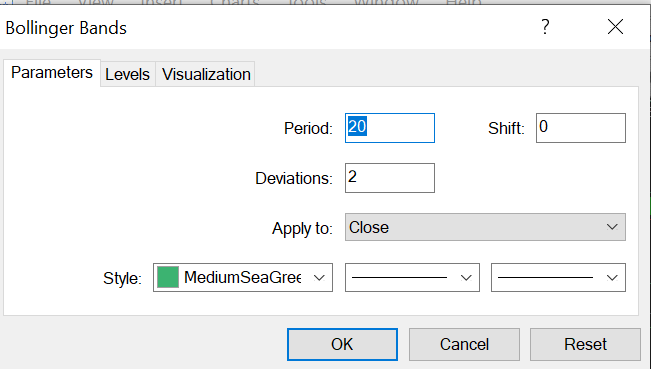
- Click ‘Edit’.
- Modify the parameters as desired.
To delete a technical indicator, in the above step 3, in the ‘Indicators’ screen, select the indicator and click ‘Delete’.
How to customise a chart
To plot trendlines, Fibonacci retracements, and other objects, click on the corresponding buttons in the menu bar.
- Cursor
- Crosshair
- Vertical line
- Horizontal line
- Trendline
- Equidistant channel
- Fibonacci retracement
- Text
- Text label
- Arrow
Text: allows you to annotate the chart. When scrolling through the chart, the text will also scroll along with it, maintaining its relative position.
Text Label: allows you to add labels to the chart. Text labels are usually pinned to the background of the chart, and they remain fixed in their position even when scrolling. This means that text labels will not move or scroll along with the chart.
Arrow: enables you to use various symbols or icons to mark specific points or events on the chart.
How to save a chart
By saving the settings of a chart as a template, you can easily apply them to other charts.
Configuring multiple charts to be displayed simultaneously is useful in situations where you want the information to be consistent.
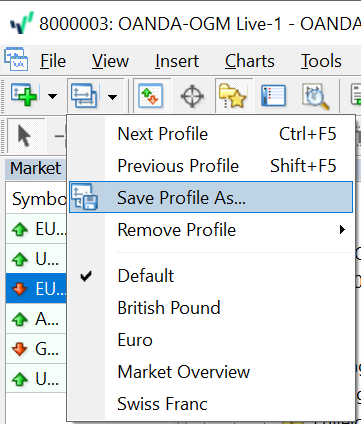
- Select the chart template and click ‘Chart Group’ in the toolbar.
- Click ‘Enter New Chart Folder Name.’
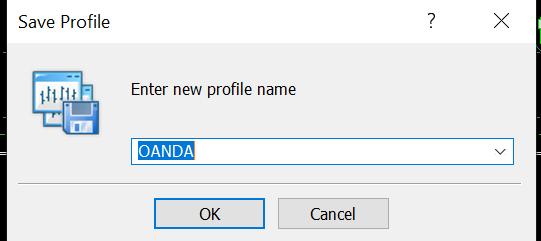
- A ‘Save Chart Folder’ window will pop up. Fill in the ‘Chart Folder Name’ (set as OANDA in this case).
- Click OK.
The saved display settings will be shown in the ‘Chart Group’ option.
To apply the chart template to other charts, follow these steps:
- Select the desired chart to which you want to apply the template.
- Click ‘Template’.


