An introduction to the Breakout Strategy: what you should know about the Heikin-Ashi and ATR in NASDAQ 100 to trade it. How to track these signals for effective trading.
Introduction to the technical indicators
In this article, we will discuss a breakout strategy for the NASDAQ 100. The NASDAQ 100 tends to exhibit a continuous trend, providing favorable conditions for trend-following trading. By identifying clear price movements in the trend direction, executing breakout strategies becomes relatively straightforward.
The technical indicators used to identify the trend in this strategy are the Simple Moving Average(SMA) and the Heikin-Ashi. The former helps confirm the overall market direction, while the latter assists in capturing trend reversals.
Using a single trend-following indicator can sometimes result in false signals and technical misjudgments. By combining them both, we can mitigate this limitation.
In this strategy, the ATR is used as a benchmark for order placement. By using the Average True Range(ATR) value as a reference, we can set the range for take-profit and stop-loss levels, eliminating the need for hesitation in deciding when to place orders.
Here is an overview of the technical indicators used in this trading strategy:
| Heikin-Ashi | The modified indicators based on the candlestick chart patterns can indeed facilitate the easy identification of trend initiation, continuation, and reversal. When a trend is forming, it often exhibits a series of consecutive candlesticks with the same color (bullish or bearish), indicating the persistence of the trend. However, when a trend is transitioning, the color of the candlesticks will change accordingly (from bullish to bearish or vice versa) as part of the trend reversal process. |
|---|---|
| SMA (30) | SMA calculation is quite straightforward, as it provides the average value of closing prices over a specific period. It serves as a basic trend-following indicator that helps determine the direction of the trend based on the inclination of the SMA line. In addition to the SMA, several other derived calculation methods are also available. |
| ATR | ATR stands for ‘Average True Range’. It is an oscillating technical indicator that displays the average price movement over a certain period. Regardless of whether the market trend is bullish or bearish, the ATR value tends to increase when there is significant volatility. It is commonly used to set take-profit and stop-loss targets. |
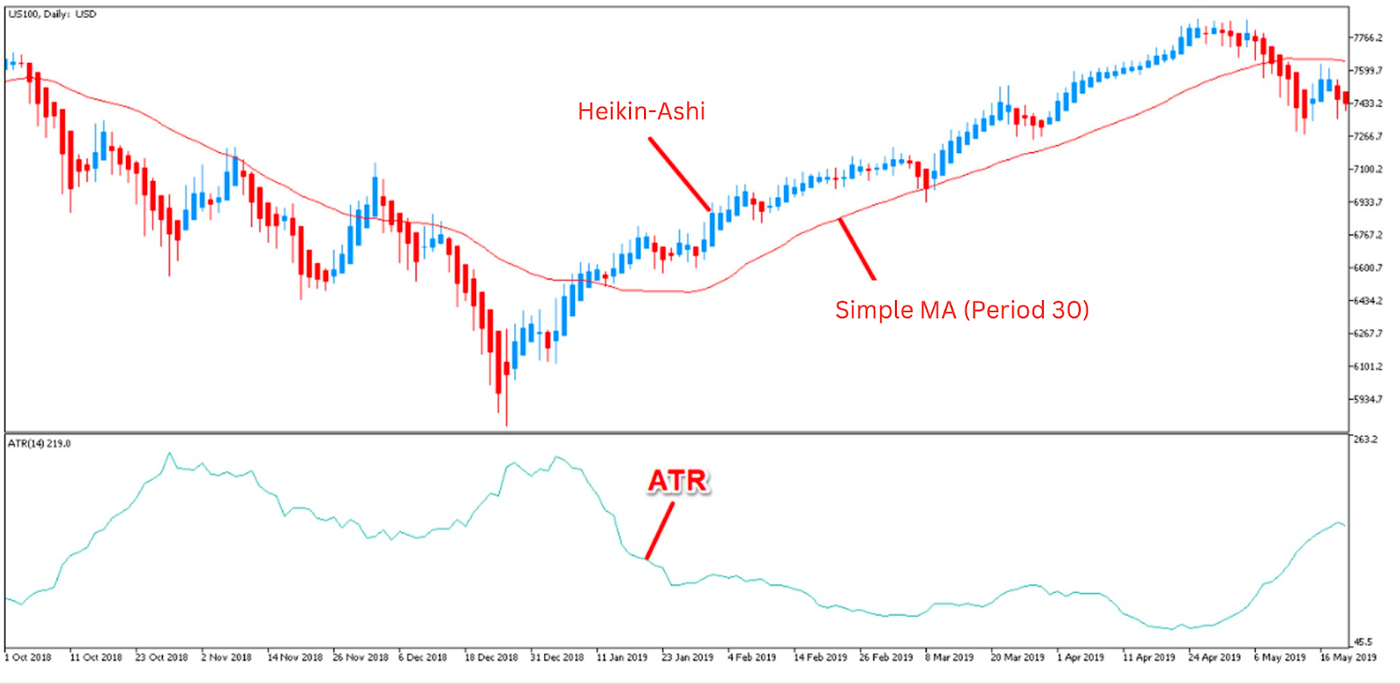
The chart below shows a daily chart of the US NASDAQ 100, with a 30-period simple moving average (SMA), Heikin-Ashi, and ATR. The direction of the SMA is important, as an upward direction indicates an uptrend, while a downward direction indicates a downtrend. Additionally, the steeper the slope of the SMA, the larger the price movement.
Typically, the Heikin-Ashi maintains the same color during a trend and changes color when the trend reverses. A Heikin-Ashi that transitions from bearish to bullish near the rising MA is a buying opportunity, while a Heikin-Ashi that transitions from bullish to bearish near the falling MA is a selling opportunity.
Trading steps
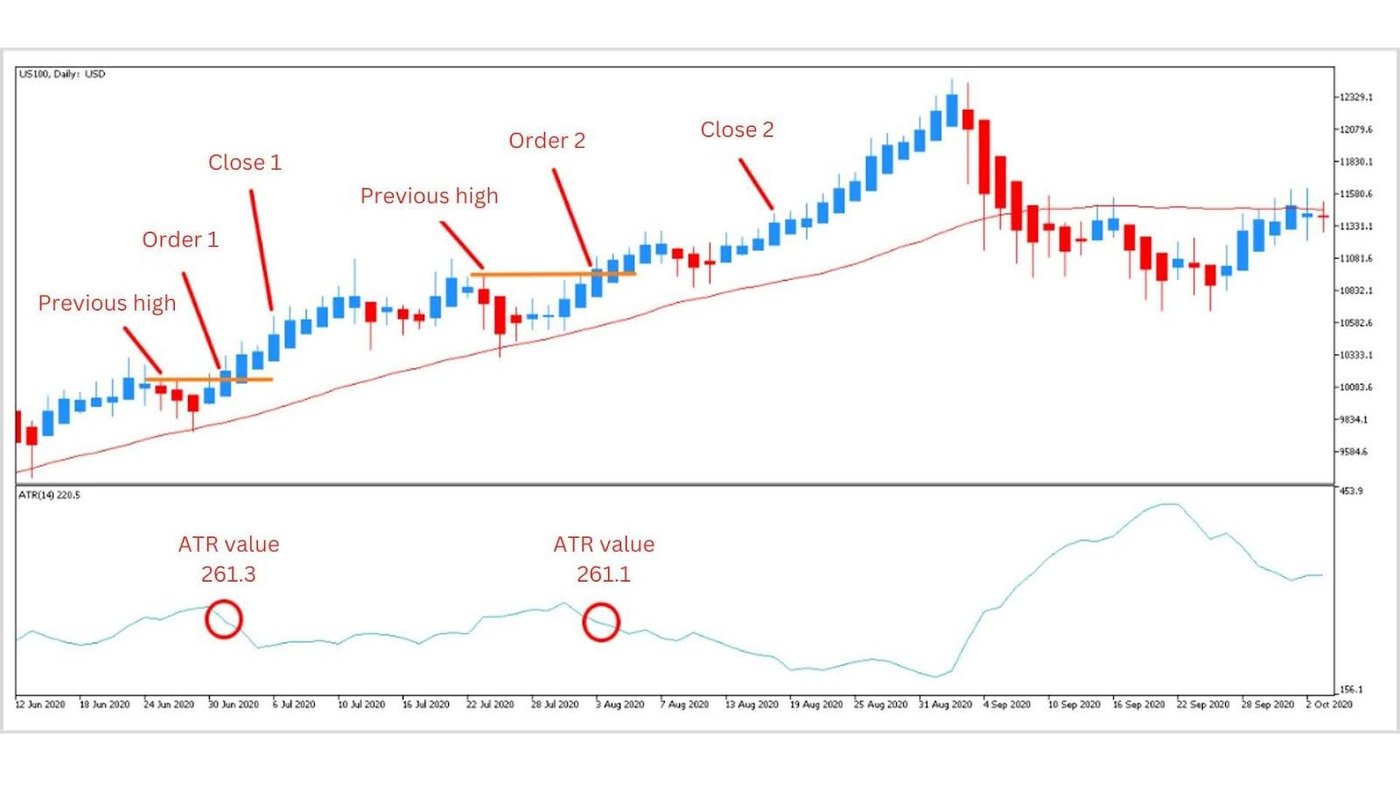
By using the SMA to grasp the overall market direction, you can effectively enter buying positions on dips or selling positions on rallies in line with the trend. However, it's important to note that it's not simply a matter of buying on a bullish reversal or selling on a bearish reversal near the SMA. The key is to wait for a breakout above the previous swing high (in the case of a bullish trend) or below the previous swing low (in the case of a bearish trend).
By waiting for these breakouts, the precision of entries can be improved. Now, let's outline the steps for entering trades based on capturing an uptrend. The same principles can be applied in reverse to identify selling opportunities in a downtrend.
Step ①
Determine the overall trend using the SMA
You should first confirm the direction of the SMA with a 30-period.
If the SMA is sloping upwards, it indicates an uptrend. This would be a buy signal.
Step ②
Confirm the high of the previous consecutive bearish swing
When the Heikin-Ashi shows a series of bearish candlesticks and approaches the vicinity of the SMA, you should identify the high reached during that bearish swing.
Step ③
When the price breaks above the high of the previous consecutive bearish swing, it can be considered a potential entry point.
Observe the Heikin-Ashi as it approaches and temporarily declines near the SMA. Then wait for the closing price to pass the high of the previous consecutive bearish swing before entering a buy position.
Step ④-A
Take-profit
To calculate the profit target, multiply the ATR value by a factor of 1.8. For example, if the ATR value is 250 points, set the profit target at a price level that is 450 points higher than the entry price (250 * 1.8).
Step ④-B
Stop-loss
To calculate the stop-loss level, multiply the ATR value by a factor of 1.2. For example, if the ATR value is 250 points, set the stop-loss order at a price level that is 300 points in the opposite direction of your entry price (250 * 1.2).
Summary
To optimise the risk-reward ratio, set the entry point for buying as the high of the previous consecutive bearish additional several points and the exit point for selling as the low of the previous consecutive bullish swing minus some extra points. By combining these two trend-following technical indicators, you can identify significant breakouts in clear trends and reduce the risk of false signals.
Furthermore, by fixing the risk-to-reward ratio using the ATR at 1.2:1.8, you can aim for low losses and high profits in your trades.
To further enhance accuracy, you can also adjust the entry point by subtracting α from the low of the previous consecutive bullish swing.


